GeoLift experiments are big money decisions and it’s important that you can trust the results. After running an analysis and seeing the results, you may want to reassure yourself that the results you’re seeing make sense and have been thoroughly vetted. Below is a list of things that Recast typically explores before putting our stamp of approval on a GeoLift analysis.
Pre-test Fit
The first thing to inspect is pre-test fit. We want the synthetic control lines and the test lines to look extremely similar. In particular watch out for these two things:
1. Bias
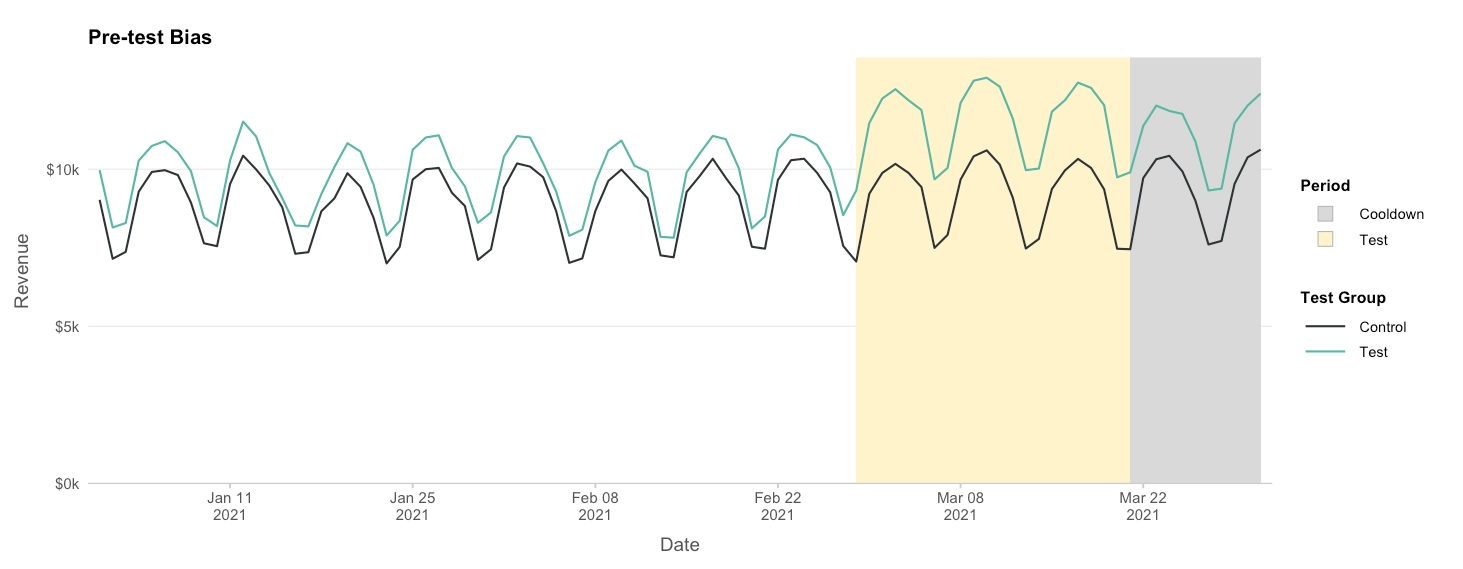
In the image above you can see the pre-test control group is consistently below the pre-test test group. This means the weighting scheme failed to find appropriate weights to make a good synthetic control group. You should not trust results if the pre-test period looks like this.
2. Patterns
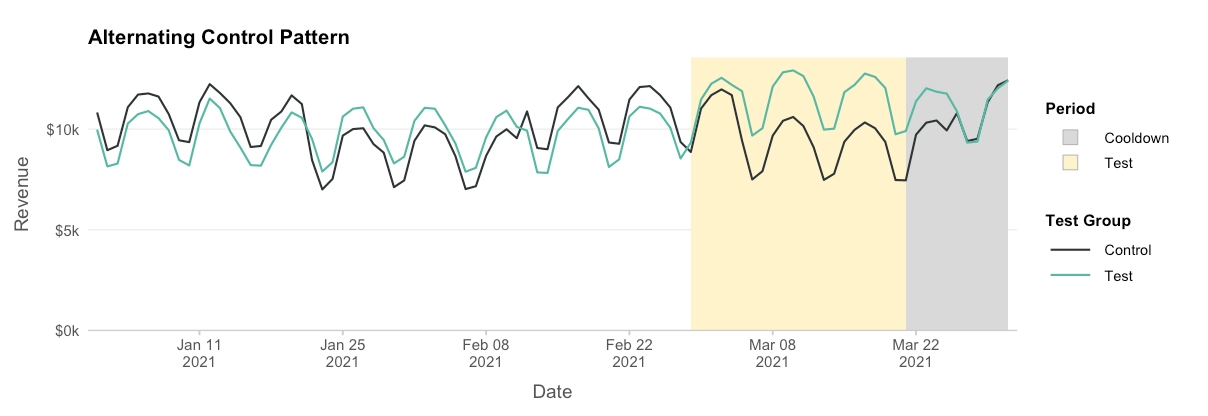
Another thing we want to avoid is distinct patterns in the pre-test fit. You’ll notice in the example above the control group is consistently high, then consistently low, then consistently high. An ideal fit would not have distinctive patterns in the residual between the synthetic control group and the test group.
Post-test fit
Another thing to take a look at is the fit during the test and control. You want to watch out for outliers that may have happened in a single test (or control) region that are skewing your test:
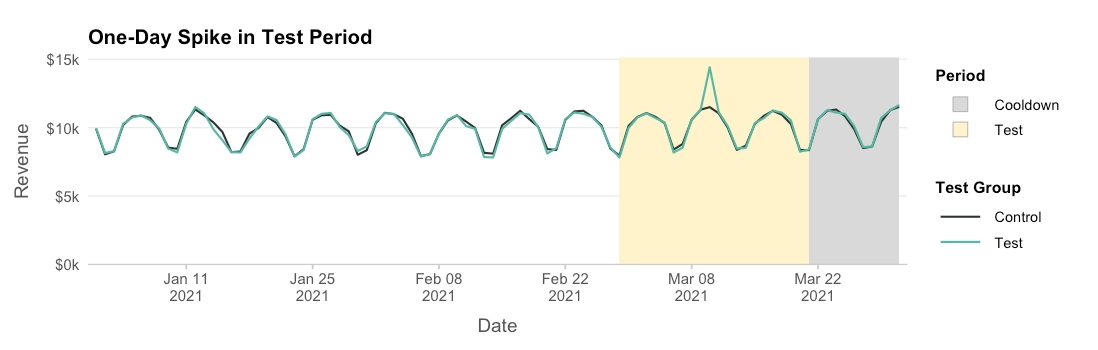
You may need to investigate the cause of these outliers. If the cause is unrelated to the spend changes you made, these could skew your results. In extreme cases, you may need to re-analyze your data after removing the test geography (and its associated spend changes) completely.
Spend
Suppose you’re testing Google search. One thing that should be true is that the ratio of spend going to the test geographies in all channels besides Google spend should be more or less the same. Making a graph like this can be helpful:
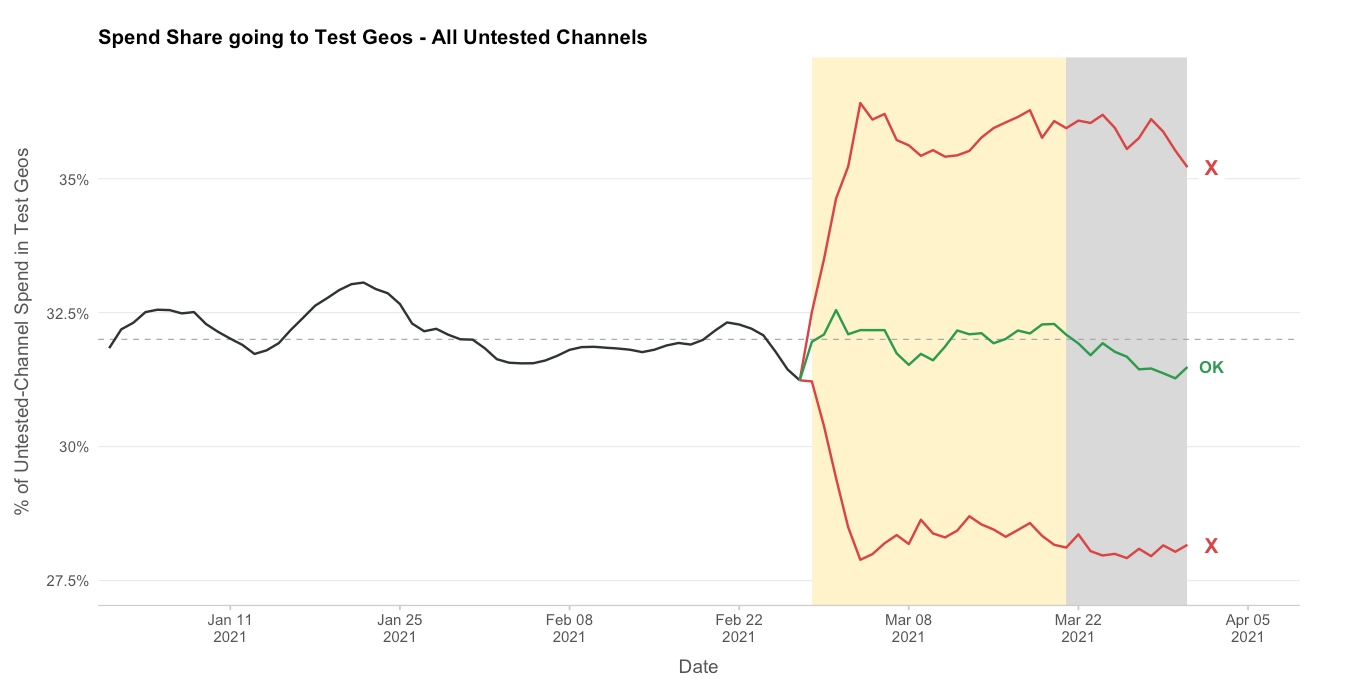
If the test geographies has traditionally gotten about 32% of your spend, during the test it should stay at roughly 32%. If there are noticeable departures, this is a sign that you may not have been testing what you thought you were testing, and the effect you’re measuring may not be isolated to the single channel you care about (in this case, Google Search).
Finally, it’s important to check that the number you put into GeoLift as the spend reduction (or increase) actually matches what changed in the test geographies. The simplest case is one in which the spend went from $0 to anything else (testing a brand new channel). In that case, the number you gave us should just be the total spend in the channel during the time period. In cases where the pre-test spend was not $0, you’ll need to create a hypothetical “business as usual” line like this:
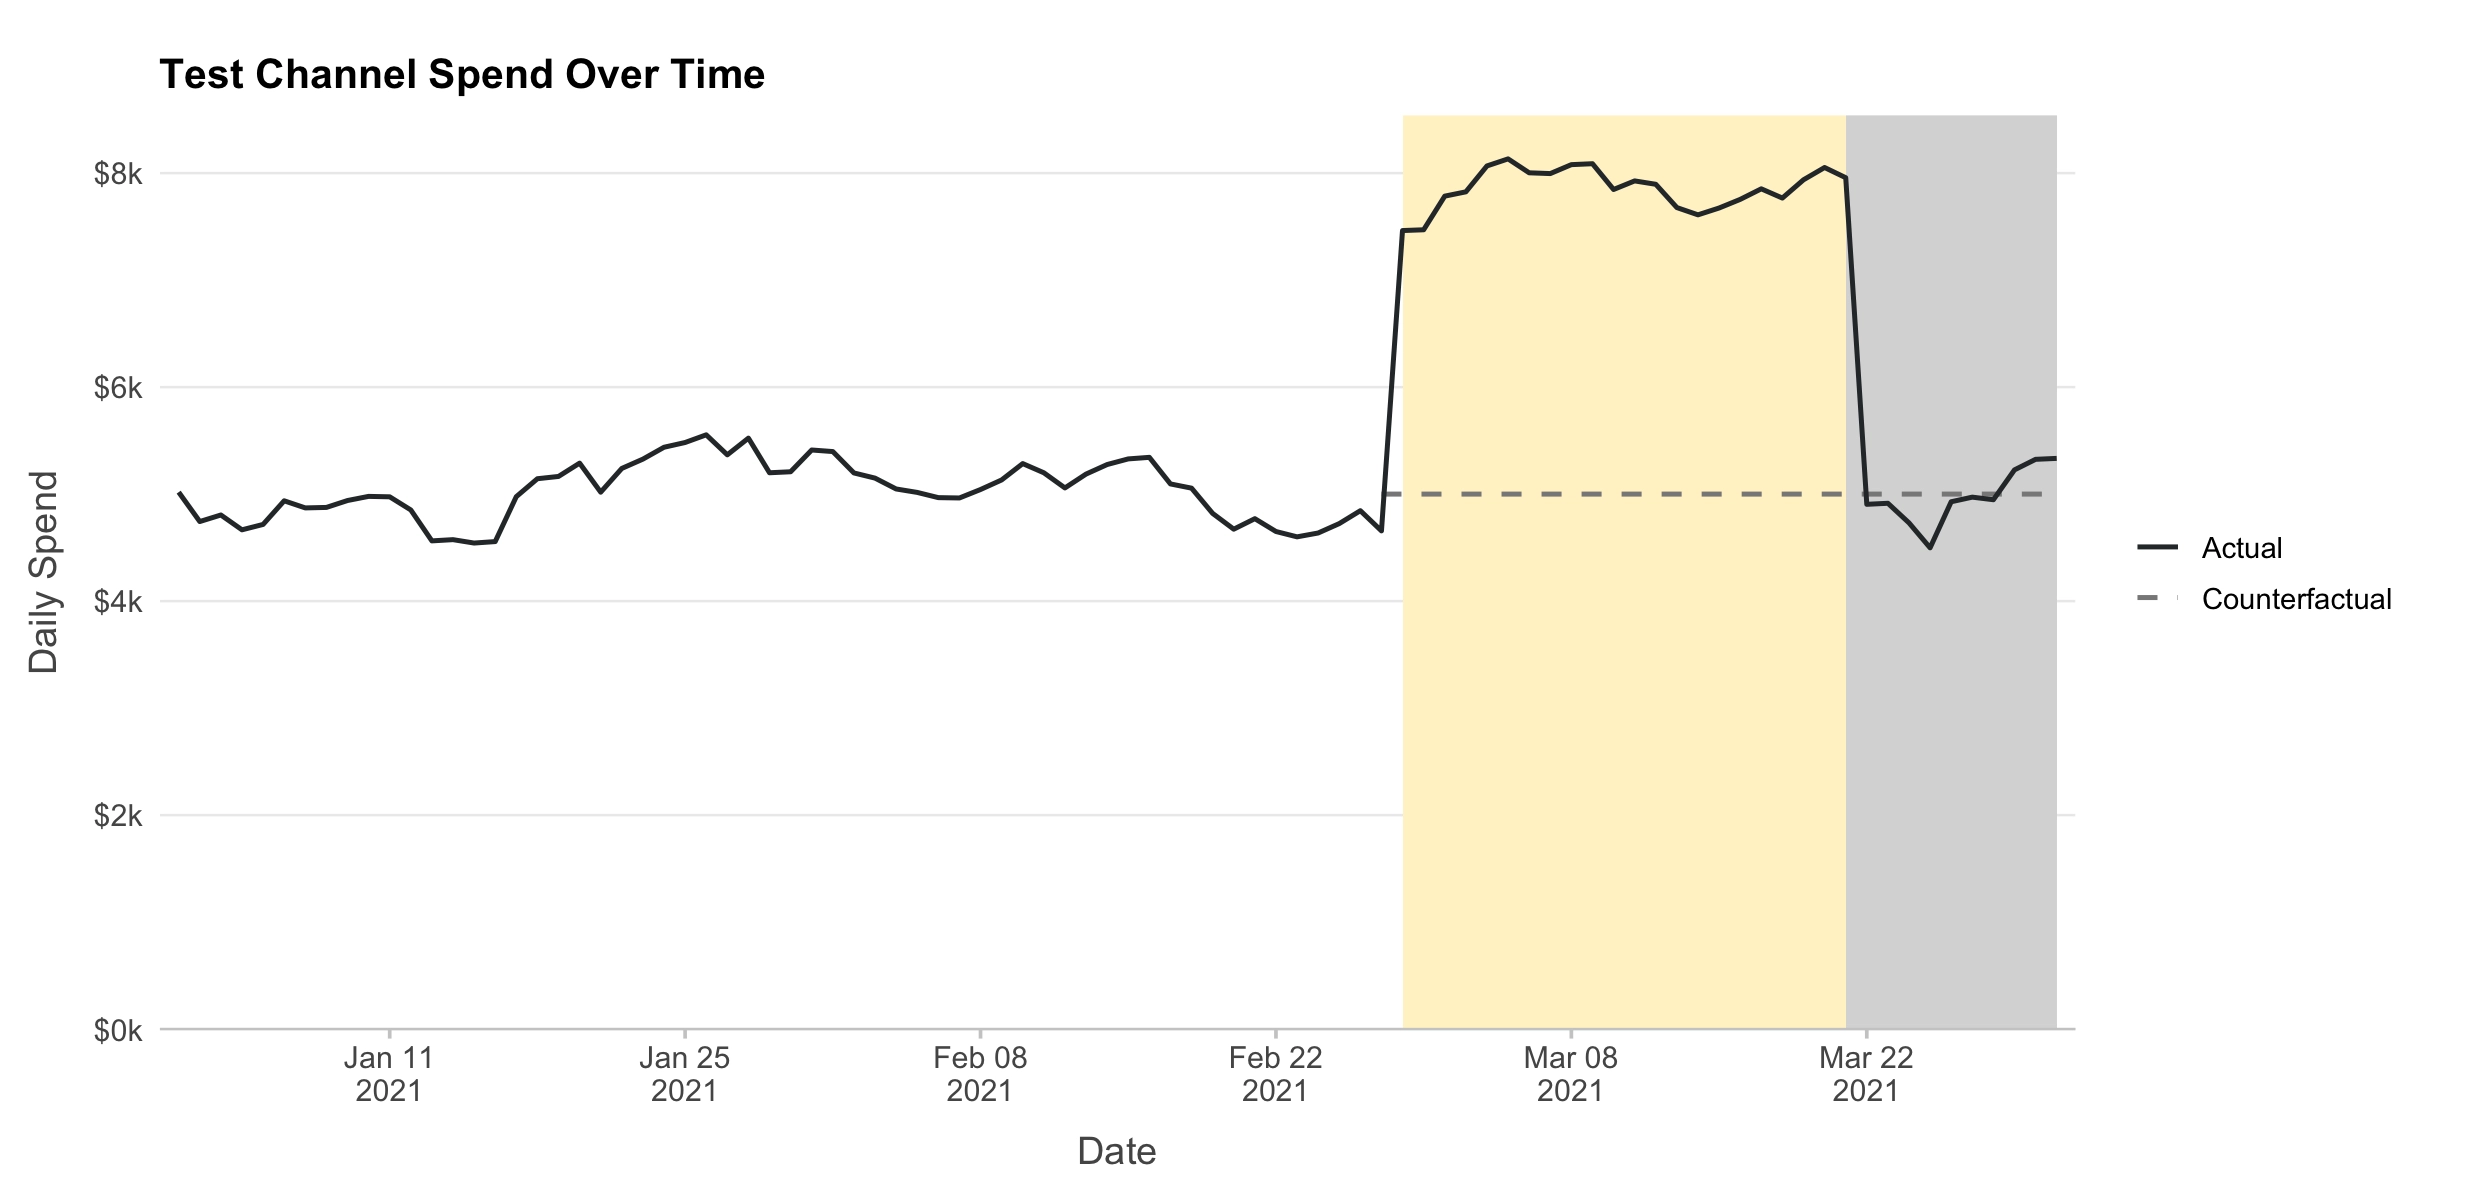
In the case above, an extra $3k/day was spent in the test region above business as usual, or about $60k total. Double check that a spend analysis like this matches the number you input into GeoLift.
Finally, this also supposes that spend in the channel of interest in the control stays the same before and during the test. If that’s not true, it doesn’t invalidate your experiment, but more care needs to be taken when supplying the spend numbers. More info on how to correctly account for that can be found here.