The main goals of the Design tool is to select geographies to include in your test and control groups and get a spend recommendation for the test group.
Step 1: Ingest your data
First we need a dataset of the historical outcome variable (KPI) for each day for each geography. The KPI is an actual outcome you care about, like sales or conversions (less commonly upstream indicators like leads or visits). These are total outcome numbers, not attributed numbers to a given marketing channel. Geographies can be at any level that you have the ability to target (e.g. states, DMAs, etc). If you use ZIP codes as the geography, GeoLift can automatically convert these to commuting zones. To design an experiment, you will need at least 90 days of data, with closer to a year of data preferred. Additionally, we require twice as much data as your experiment length (for example, if you want to run a 12 week experiment, we will need 6 months of data uploaded). Your CSV should contain 3 columns:
-
Location (geography)
-
Date
-
KPI
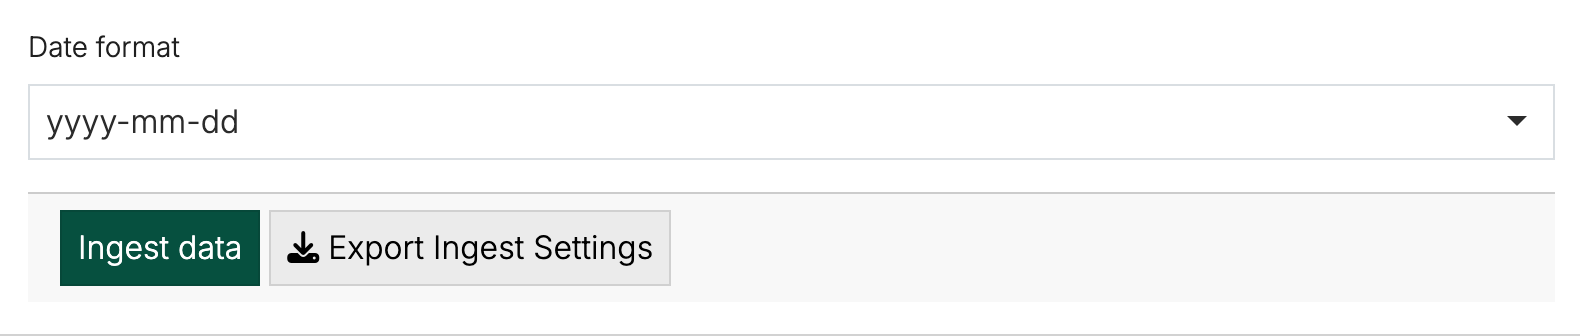
You can use the tool to map the columns in your dataset to the date, outcome variable and location ID columns as well as specify the date format in your dataset. If a geography/date combination is missing, or if the KPI value is missing for a particular geography/date combination, GeoLift will assume the KPI was 0 on that day.
A template dataset you can use to test things out is available in the app:
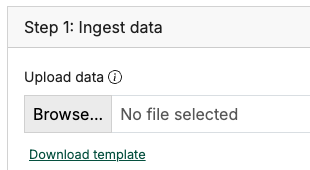
Once you have mapped your columns, you can ingest your dataset. You can see your KPI over the time period for your top 8 geographies by volume as well as click through your dataset. Use these visualizations to check for any data problems.
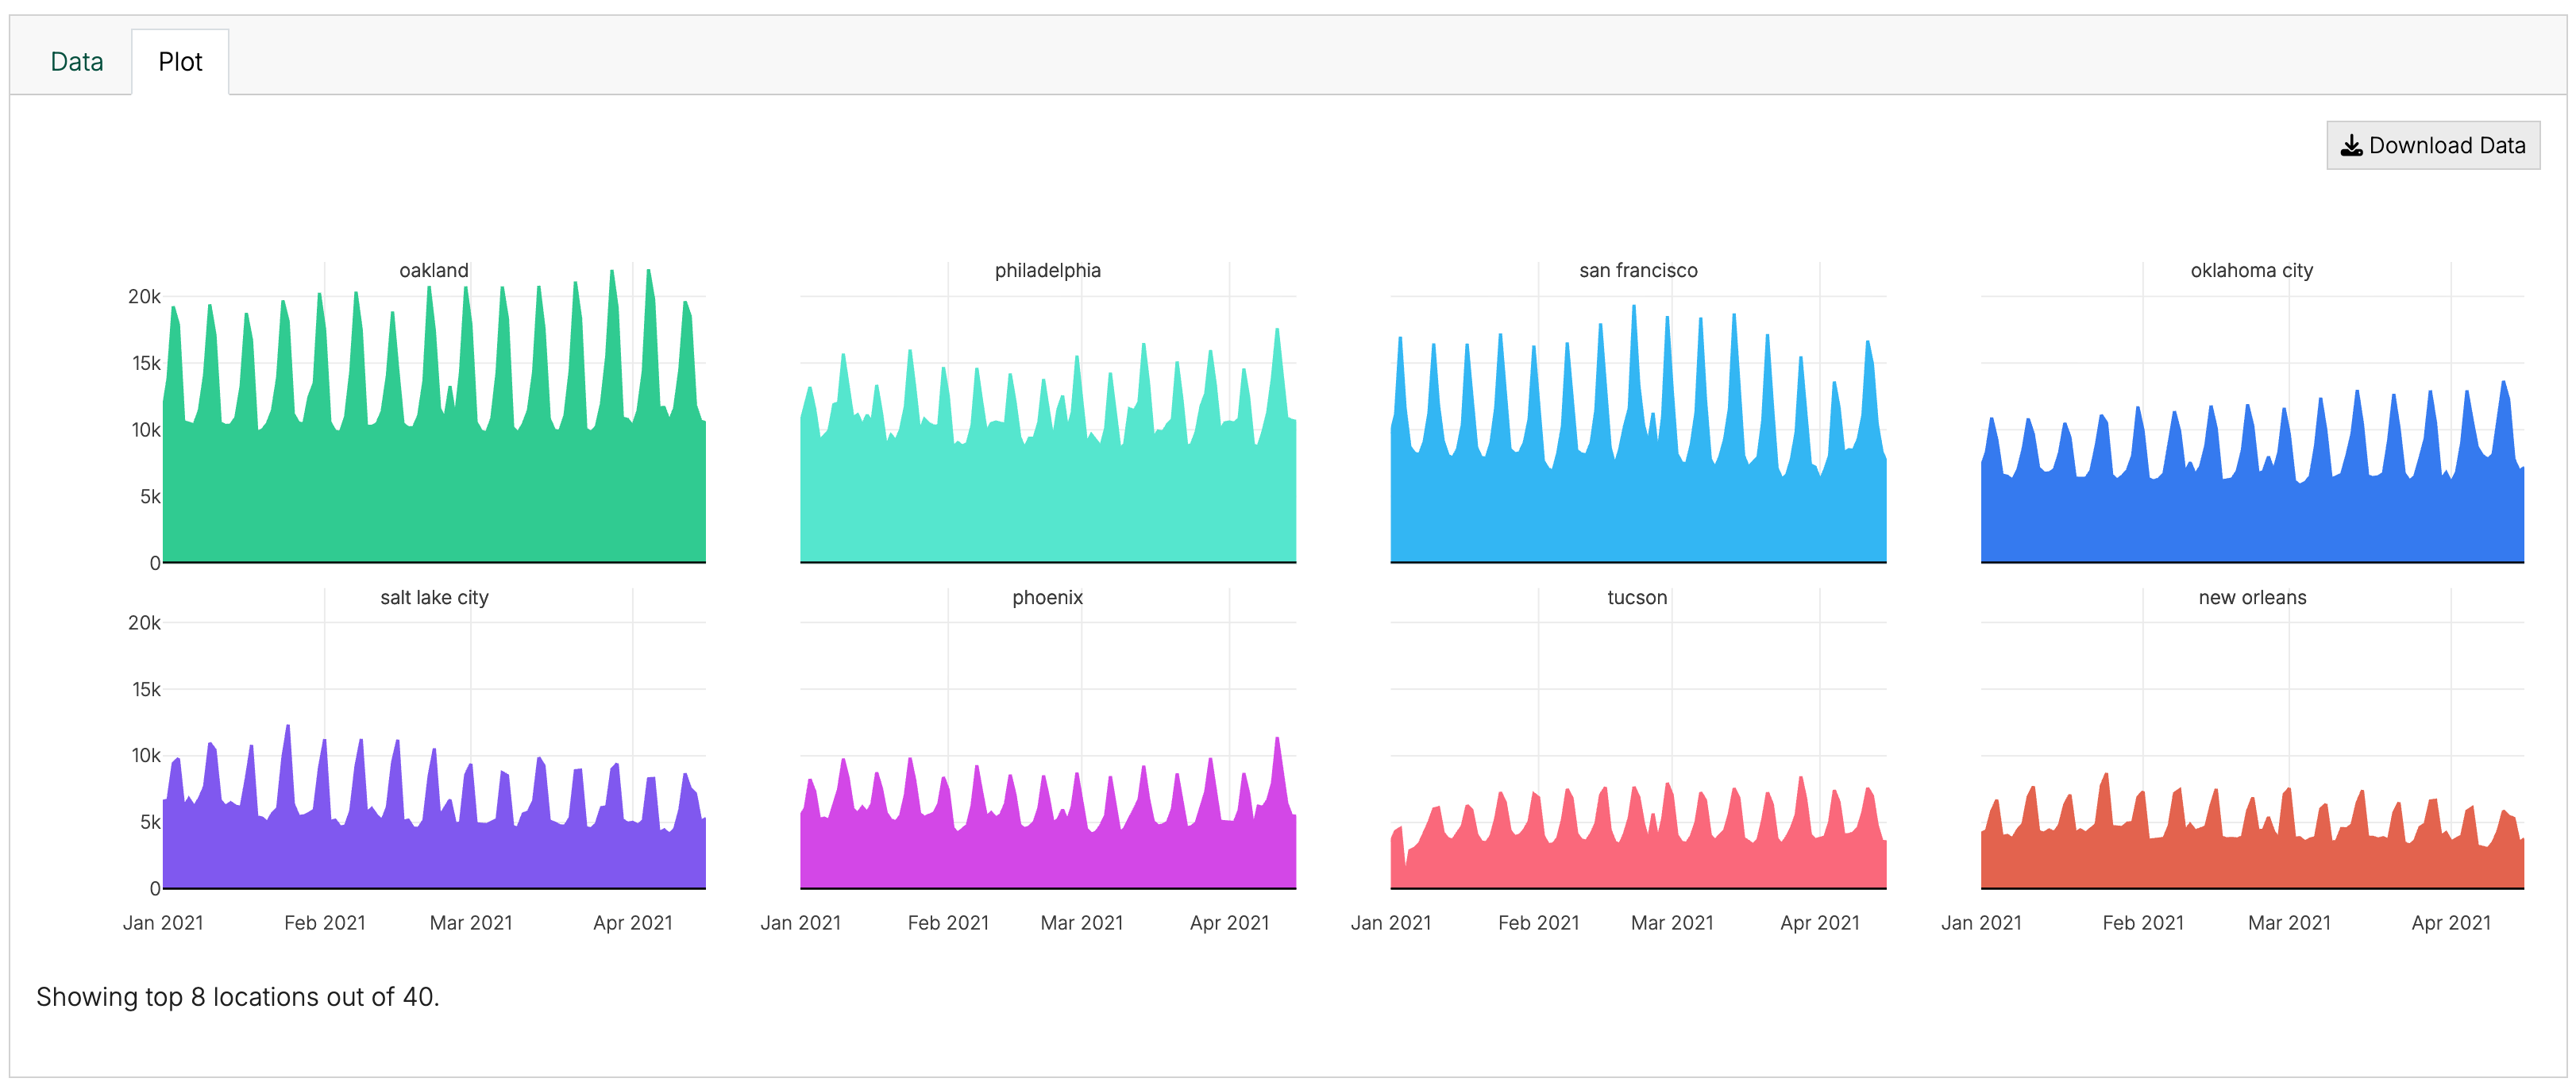
The historical dataset helps the experimentation tool analyze similarities and differences in geographical performance to select the best geographies to include in your test group. Comparison between geographies with similar historical performance results in more powerful statistical analysis as we can more accurately identify the differences as a result of the spend change.
What happens if I use ZIP codes?
If you use ZIP codes as your geographic unit, we group ZIP codes into Commuting Zones for design and analysis. This is because ZIP codes are too small for effective targeting and too noisy for effective analysis. Commuting Zones are an open source attempt to group ZIP codes into geographic units that limits cross-unit travel (i.e. people typically live, work, and shop in the same Commuting Zone). This makes it easier to target people with ads with lower risk of cross-contamination.
When you create a design with the Commuting Zones, the end result will deliver both a list of Commuting Zones and ZIP codes to run your test in. When you analyze the test, you will upload the raw data at the ZIP code level (since that is how it’s tracked in the system of record). When you specify the ‘test locations,’ you will provide the Commuting Zones from the design stage.
There are a few things to keep in mind with the Commuting Zones:
-
This mapping only works for U.S. locations.
-
Not every ZIP code belongs to a Commuting Zone, particularly coastal/offshore areas. When this happens, the data from that ZIP code will not be used in the design or analysis.
-
Commuting Zones are static and do not update when new ZIP codes are introduced. Newer ZIP codes will also not be used in the design or analysis.
-
The data export will produce a CSV of all ZIP codes not used in the design, along with how much KPI was excluded.
-
Only the top 250 Commuting Zones (size determined by total KPI in the Zone) will be considered in a design.
-
Exclusions from the test or control group happen at the Commuting Zone level.
-
ZIP codes like “04743” are expected to have leading 0s. Excel often removes these 0s, so be careful they don’t get removed before you pass your data to GeoLift by Recast.
-
Additional digits after the first 5 in a ZIP code will be ignored, so ZIP+4 codes will be treated as if they were simply ZIP codes.
Step 2: Configure your analysis
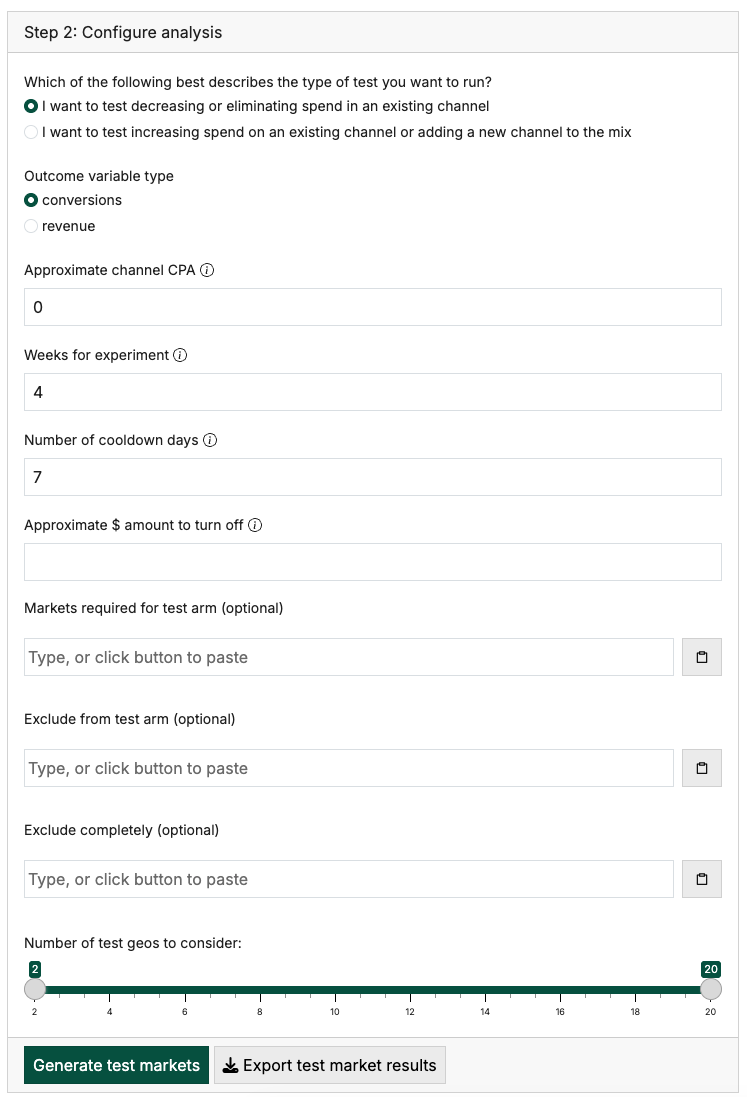
During the configuration phase, you will provide parameters for GeoLift to work with. GeoLift will use those parameters to run simulations in order to determine which geographies would make up the best test as well as a recommended spend amount to get usable results.
First select your experiment type.
There are two types of experiments:
Spend increase: This type of experiment makes sense when you have extra money and want to increase your KPI, you think you might be underspending in the channel and want to test increased spend, or when you are adding a brand new channel to your mix.
Spend decrease: This type of experiment makes sense when you want to save money (at the cost of some of your KPI), or when you think you might be overspending in a channel.
If you’re not sure which to do you can do the analysis twice and compare the recommended plans for each type.
What if I want to do a run a go dark test where the spend is all the way off?
While we don’t support that directly, you can design your test as a spend decrease test and as long as the amount of spend you turn off in the test geos is greater than the recommended spend to turn down, the results you get will be at least as statistically powerful as the recommended “spend decrease” test. If the recommended amount of spend to turn off is greater than the total spend in that set of geos, you will want to explore other geographies as turning off spend completely won’t provide an adequately powered test.
Next, select the KPI type: revenue or conversions. If your KPI is not either, select conversions if you think in terms of CPA and revenue if you think in terms of ROI.
Then select your experiment parameters.
Approximate Channel ROI/CPA: Your expected ROI/CPA helps Recast calculate the amount of revenue/conversions you can drive in your test group. For example, if you want to spend $10,000 and think your CPAs are around $100, this means we can simulate 100 additional conversions in the test geographies and estimate whether that provides statistically meaningful lift. In general, using a conservative number (high CPA / low ROI) will result in a more conservative test, meaning GeoLift will recommend more dramatic changes and you’ll have more statistical power.
Experiment length: Provide how many weeks you want to run the experiment.
Cooldown period: The cooldown period after the experiment is a time period where you are no longer spending extra in the channel, but you are still observing the test geographies because revenue/conversions are still coming in from the previous spend. Choosing a short cooldown period might cause you to miss conversions/revenue, while choosing a long time period will cause additional noise that makes it harder to estimate precise ROIs. GeoLift requires the length of the experiment plus the cooldown period be at least 10 days.
Approximate $ for test (or to turn off): This is a starting point for how much money you would hope to spend on the test. Recast will first take this spend amount and your efficiency expectations and try to find geographies for which this size of experiment produces a meaningful result. If it cannot find any, it will error and you may need to increase the size of this (or up your ROI expectations). Once it has found a set of geographies with good potential, step 3 will do additional simulations to refine the spend recommendation.
Optionally, you can select certain geos to include or exclude in your test geo. If you leave this blank Recast will select the optimal test geo for you. This can be useful if, for example, you cannot increase the spend in certain geos or you want to exclude certain geographies because other changes happening in the geography may confound the experiment. Alternatively, you can use the Exclude Completely to ensure locations are not used in the design of your experiment at all. Clicking the clipboard icon by these inputs will paste your clipboard contents into the box. Please note, clipboard contents need to be separated by new line characters (like they are when copying from Excel) or semicolons to be pasted correctly.
Number of test geos to consider: this allows you to place limitations on the number of geographies you test in. By default, GeoLift allows between 2 and half the total geographies, but you can narrow this down. The simulation engine will try different combinations of geos between whatever high and low numbers you put in
For thoughts on how to ensure your test group generalizes to the entire population, check out this blog post.
Click “Determine test markets” when you are ready. Recast will analyze your data and provide options for various experiment configurations which you will be able to select from. GeoLift ranks the experiment options in terms of the difference between the simulated lift and the lift estimated. If Recast is unable to find test groups that result in low error and statistical significance, it will fail to generate the candidate test markets and instead recommend tweaking your settings. Increasing the spend amount, changing the number of days (for the same amount of total spend, a shorter test will be more powerful than a long test), and changing the number of test markets are all ways to increase the statistical power.
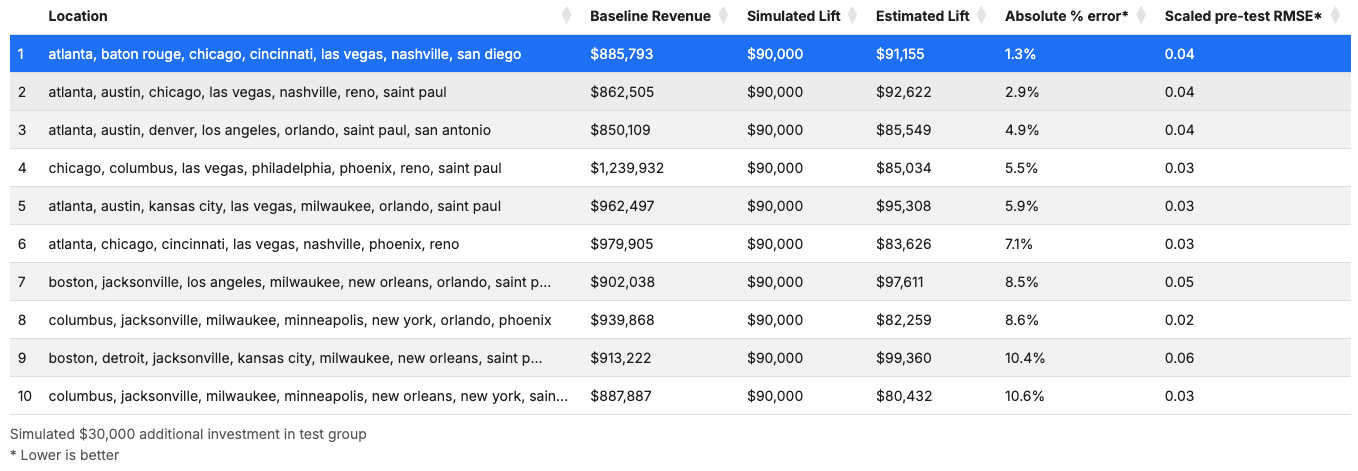
Location shows the set of geographies that belong in the test group.
Baseline Revenue/Conversions is the expected amount of revenue/conversions in the test geography in the simulated “business as usual” time period.
Simulated Lift is the additional revenue/conversions the additional investment drove in the simulation.
Estimated Lift is the amount of revenue/conversions that Recast attributed to the increase in spend.
Absolute % error is a measure of the percent difference between the true simulated lift and Recast’s lift estimate. A small absolute % error means that the estimated ROI is close to the true ROI in the simulation.
Scaled pre-test RMSE is a measure of the pre-test divergence between the modeled synthetic control and the average test geographies. It is the root mean squared-error (RMSE) divided by the average daily test region KPI in the pre-test period (to scale the RMSE based on the size of the test geographies).
Currently, the list is ranked by the lowest absolute % error statistic. The pre-test RMSE is provided as a secondary metric to consider when choosing from the list. Absolute percent error answers the question “Does the estimate I get after simulating the data match the true known value?” However, a good estimate may be obtained by having large errors in both the positive and negative directions that offset each other. The RMSE metric helps make this easily visible (bad fits with large positive and negative errors result in high RMSE). The RMSE statistic correlates highly with the eyeball test of looking at the Simulated Experiment graph and asking “Is the control fit any good?”
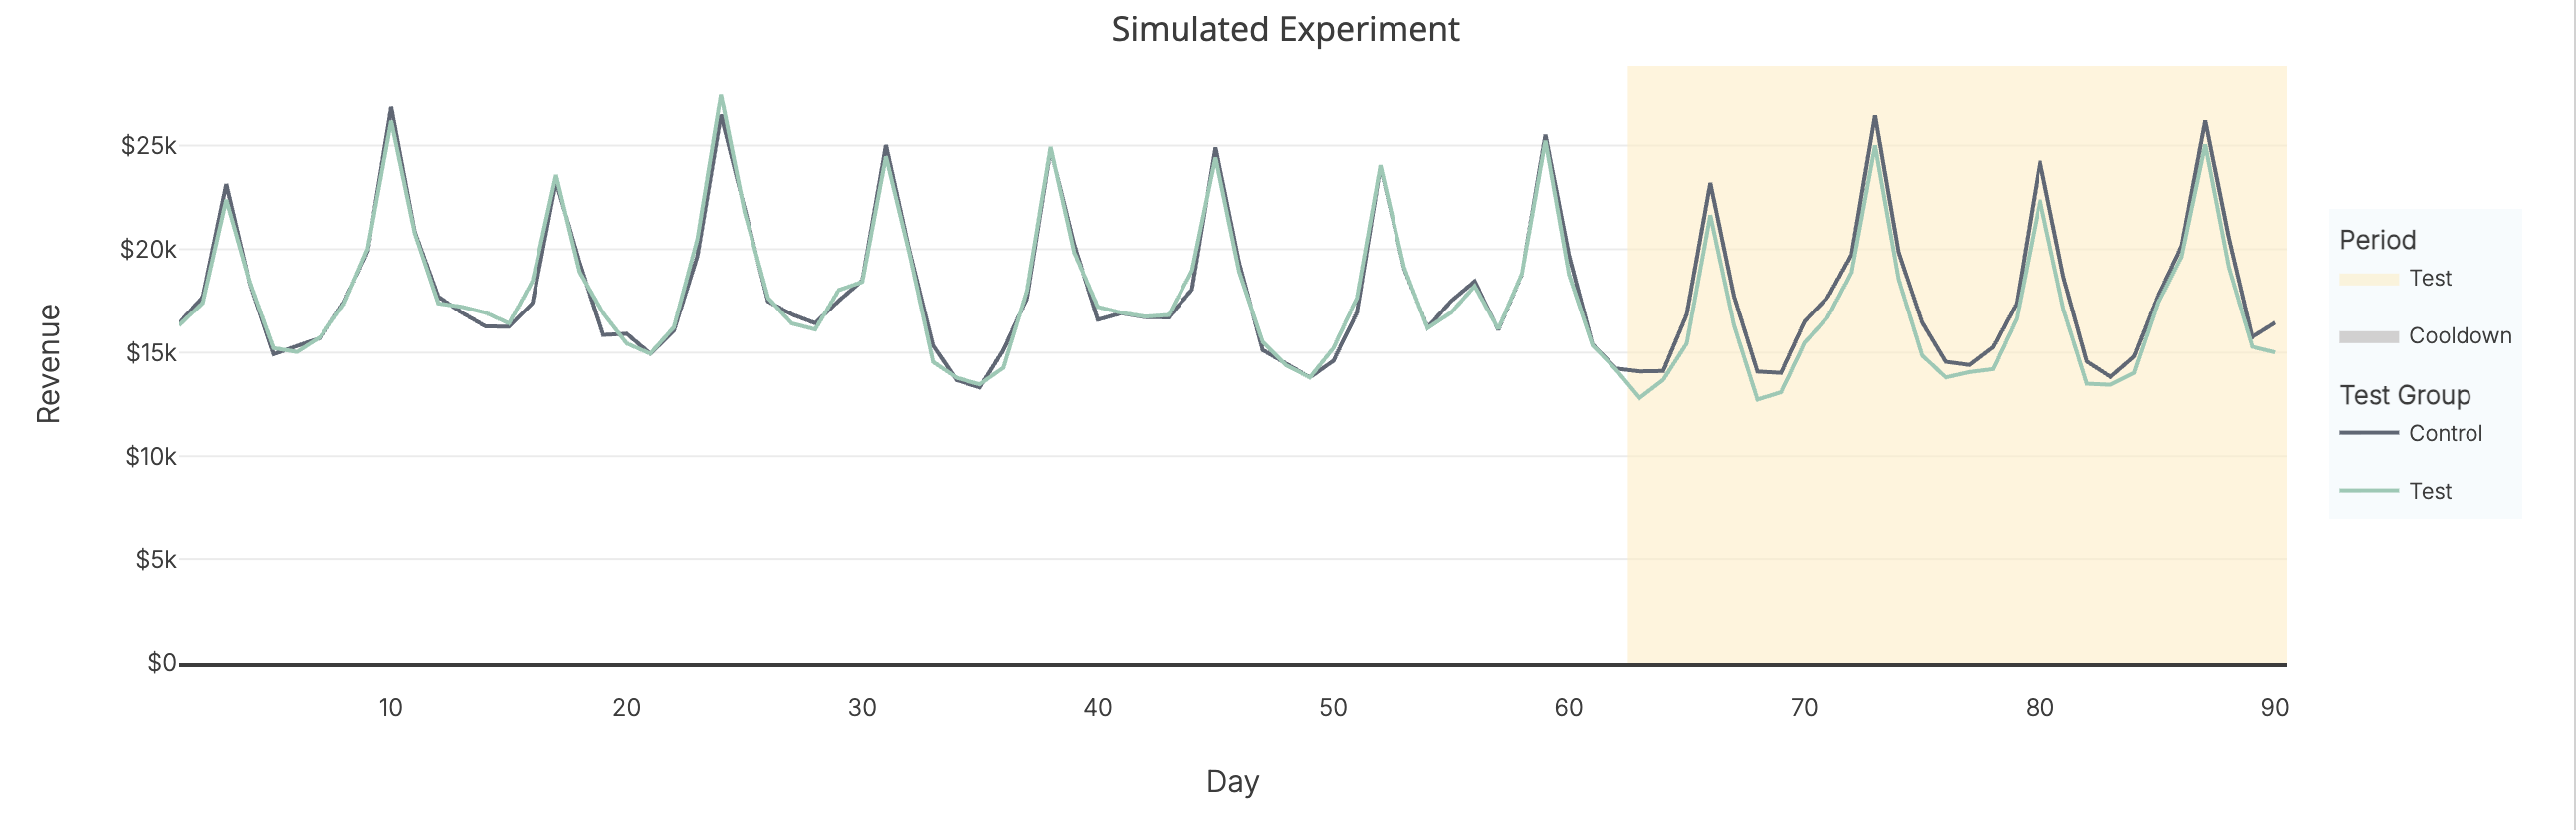
For each of the experiment configurations, you will be able to see a graph of the expected conversions over time in the test and control geos for the period of the experiment.
You can use this information provided to select a set of test geographies that meets your investment constraints and which minimizes bias.
To get a final spend recommendation for the selected locations and a deep dive into the power at different spend amounts, click “Deep Dive with these locations.”
Step 3: Deep dive power analysis
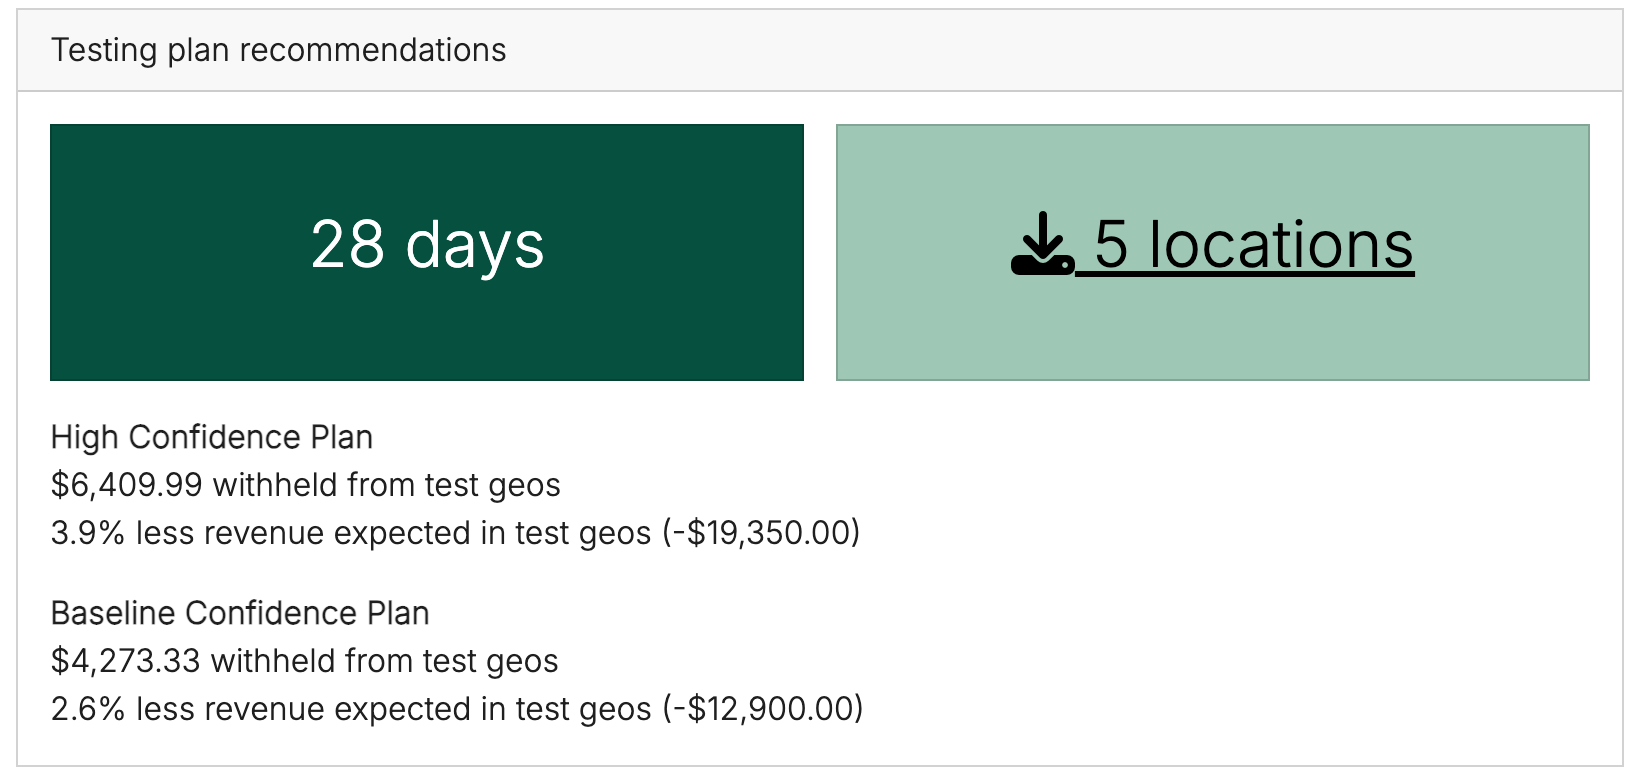
The results of your power analysis are two testing plans at different effect levels (and different spend levels), as well as an analysis of the likelihood that your experiment results in statistically significant lift.
The two testing plans are a Baseline Confidence Plan that requires less intervention while still meeting the baseline criteria for statistical significance and a High Confidence Plan that will result in smaller confidence intervals. The High Confidence Plan is calculated by multiplying the the baseline confidence numbers by 1.5.
The power analysis graphs below will help you assess the recommended plans. The power analysis runs many simulations for your selected geos in order to help determine how statistically useful the results will be.
How to use the results of the power analysis?
Use the power analysis to:
-
Determine whether the experiment configuration is sufficient to detect a statistically significant incremental lift.
-
Refine your experiment design to arrive at an experiment that maximizes your chances of detecting statistically significant results.
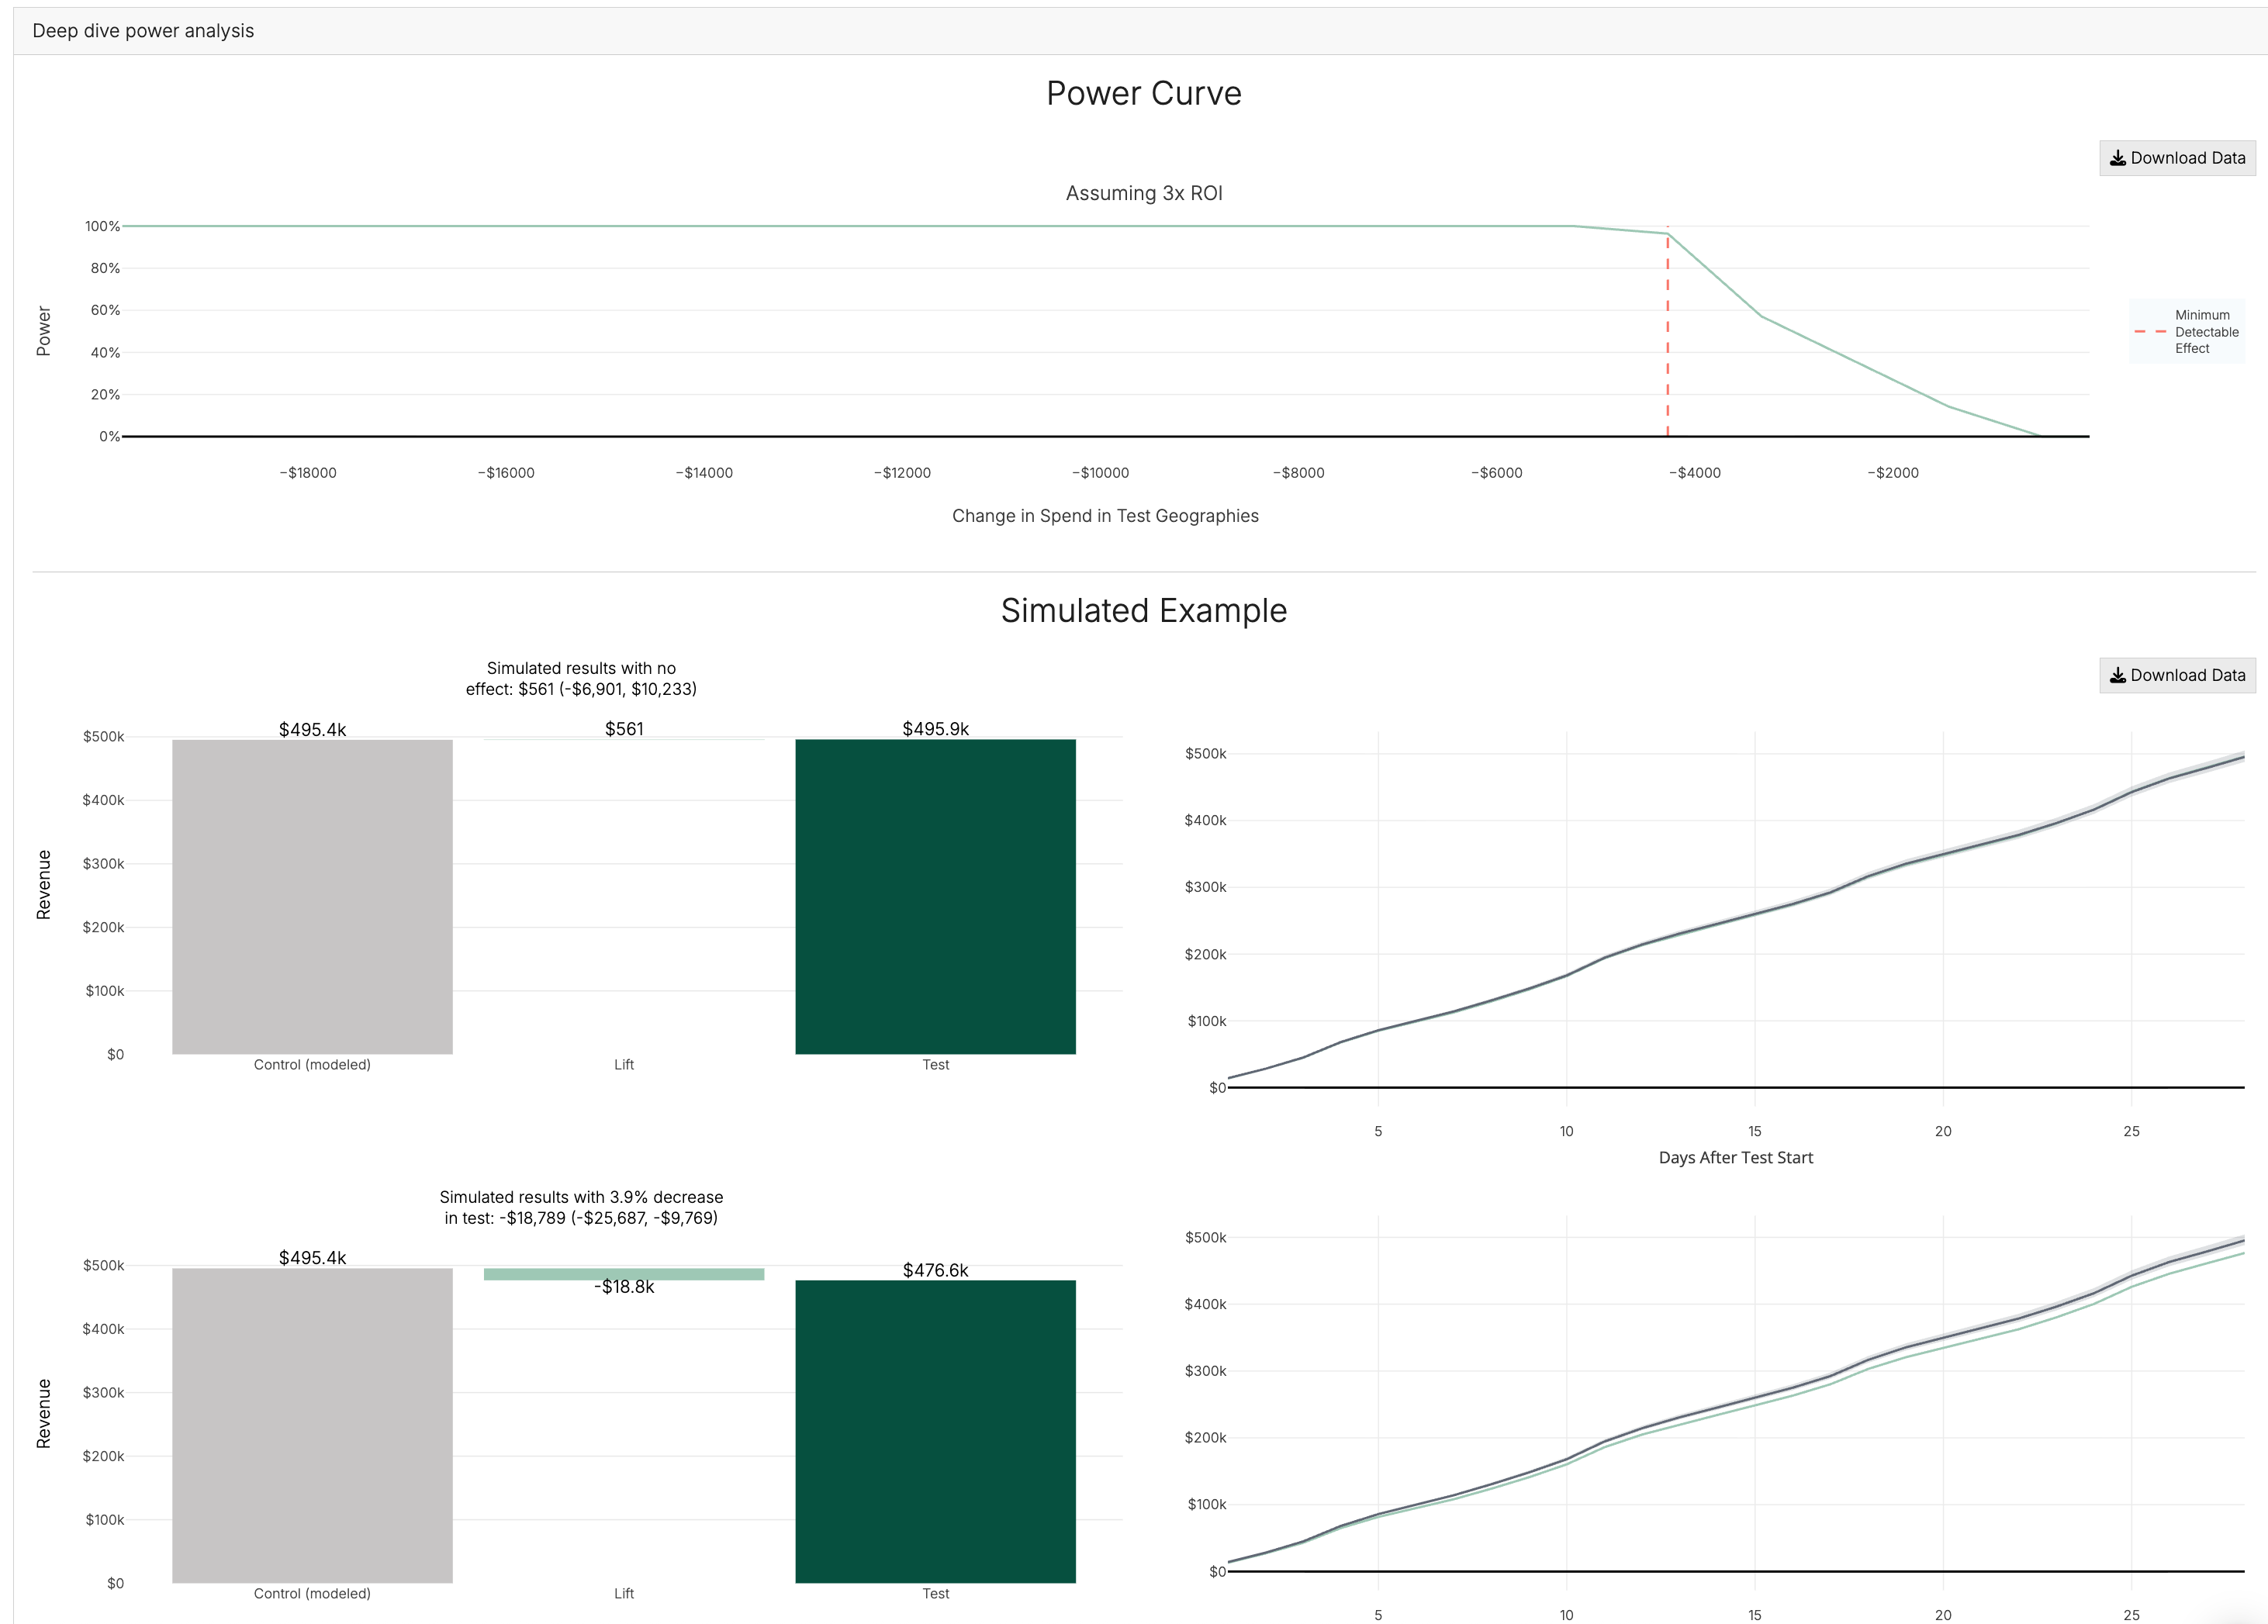
The power curve shows the probability of detecting a statistically significant effect given the test geos, expected % change in outcome, and duration of the experiment. Statistical significance in this context means our ability to confidently conclude that ROI is not zero. It is not the same as the thing we are primarily interested in, narrowing the size of the confidence interval on the ROI, but the two are related and more power will also mean smaller confidence intervals. 80% power is the minimum we’d recommend for a baseline experiment (what we call the minimal detectable effect).
The next two graphs are helpful in understanding the kind of outcomes to expect in two different scenarios: (1) where the advertising channel has no true incrementality, and (2) where the advertising causes conversions to increase/decrease by the % predicted by following the “High Confidence Plan” (using your ROI/CPA assumptions). In the example pictured below, when there is no true incrementality, GeoLift would estimate a small decrease (-$41) in the amount of revenue attributable to the advertising channel. The confidence interval would contain positive and negative values for the revenue. In the example where there is true incrementality, we estimate $55k of additional revenue in the test group ($32k - $57k confidence interval) meaning we could strongly conclude the experiment resulted in incremental lift. The graphs on the right show how we expect cumulative revenue to progress as the experiment progresses in each of these simulated scenarios.
If the results of the power analysis do not provide you with a feasible testing plan, you can go back to the experiment configuration and tweak the number of geos, extend the duration of the study, or increase your spend amount, or adjust your CPA/ROI assumptions.
What control geographies are used during the power analysis?
When we run the power analysis, we run many simulations using slightly different slices of the data. For each of these simulations, we re-fit the model to calculate new control weights, so the set of control weights will vary depending on the simulation. Therefore, there is not a single set of control weights that can attached to a design. Similarly, because time will pass between when you design the experiment and when you execute the experiment, the control weights used during the design will not be identical to the control weights used during the analysis. This is not a problem. It is preferable to always calculate the weights fresh from the latest data rather than relying on out-of-date weights.
Precision Preview
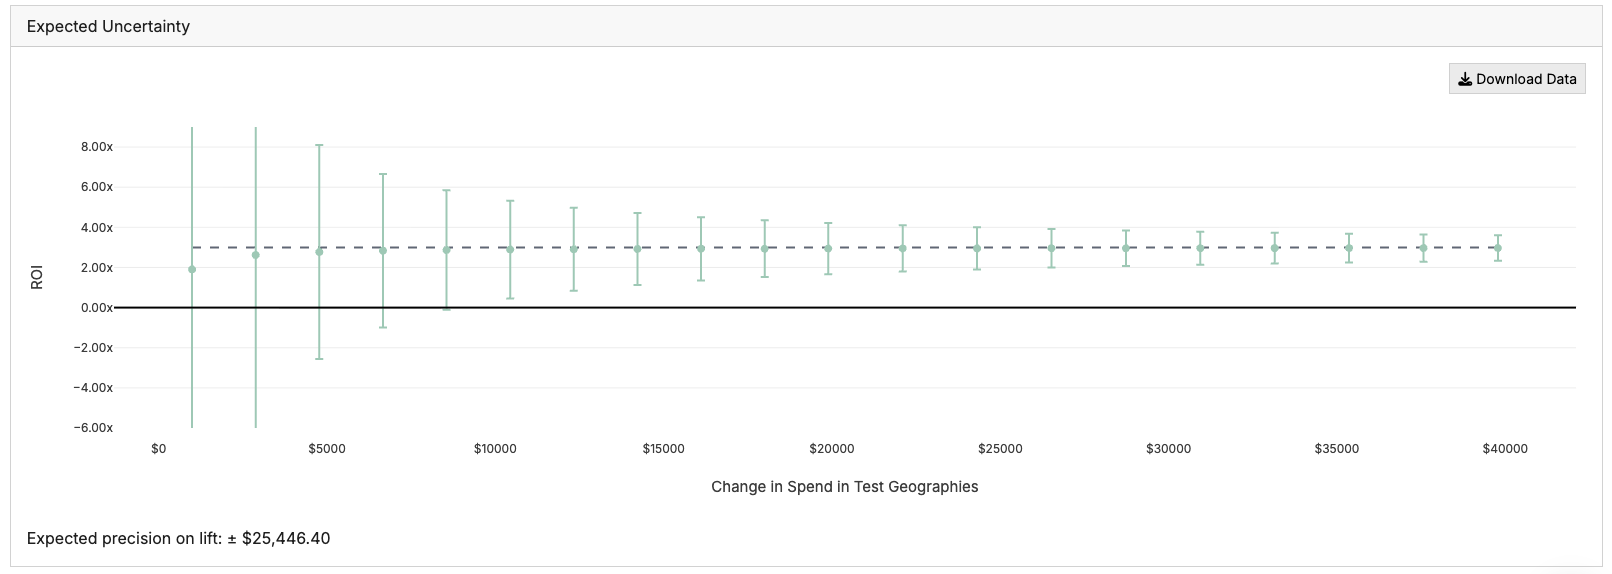
At the bottom of the analysis is the precision preview. This graph is calculated by calculating the following quantities from the 28 simulated experiments:
-
The average point estimate
-
The average width of the 90% confidence interval
We then visualize these on the graph to show how much uncertainty you can expect in your ROI/CPA estimates if you were to run this test. For CPA models, we plot the uncertainty of the lift per $1,000/spent because of the asymmetrical nature of CPAs (CPAs go to infinity when there’s no effect), but you can see the CI of the CPA by hovering over the graph.
The precision on the total increment lift estimate is constant for all possible dollar size experiments because it’s determined by the relationship between the pre-test and test control data (not the simulated test data), so it is noted at the bottom.
Precision preview is only available for REBA, because calculating full confidence intervals using the Basic algorithm is too computationally expensive to do in a reasonable amount of time.
Precision preview provides an alternative way to power to think about sizing an experiment. The “Baseline Confidence” recommendation is based on the standard statistical procedure of recommending the smallest amount of money that can be spent and still reject the null hypothesis of no effect (at the hypothesized effect level). This will often still leave quite a lot of uncertainty in the overall ROI. This graph can help users assess whether the experiment they are considering will leave them with enough certainty after the test to be practically useful.
Average Control Group
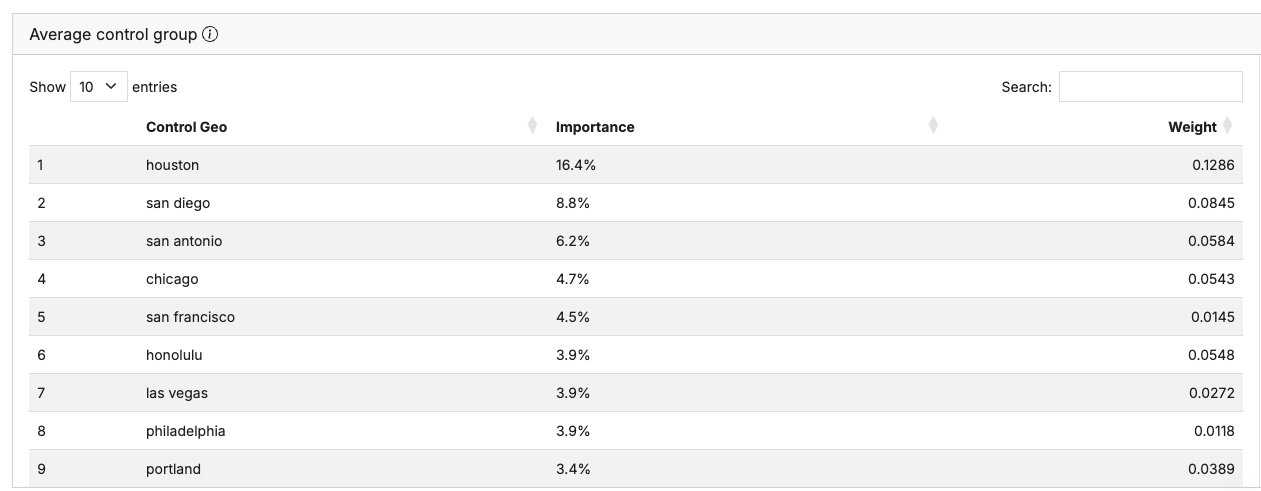
In order to determine if the test geographies are a good candidate, we fit synthetic control models over different time slices of the data (working our way backwards in time). Each of these slices gets its own model with its own control weights. Therefore, there is not a single “control” group that can be juxtaposed against the test group, the control group is whatever fit the data best in the pre-treatment time period for that simulation. However, we can average over all the control groups to present an approximate control group that shows what control geographies were most important on average.
There are two important things to remember about these average controls:
-
These are not the controls that will be used when you analyze the data. Instead we will weight the controls based on how well they fit the pre-experiment data. There is currently no way to override this and use the control weights from the Design step.
-
In general, the more time that passes between when you ran the design and when you started the experiment, the more different the Design step average controls and the actual controls will be. This is because more data comes in each day until you start the test that help inform the model what the best controls are.
How does power analysis work?
GeoLift by Recast uses historical data and statistical simulations to conduct power analysis. Here’s how it generally works:
Recast simulates the effects of your experiment. Based on the input parameters you provided while configuring your Geolift experiment, Recast runs multiple simulations to estimate the probability of detecting a true causal effect of the spend change as well as the probability of making erroneous conclusions from your results.
Estimate Power: By analyzing the simulation results, Recast estimates the statistical power of the study. It determines the likelihood that the experiment configuration, given your input parameters, will detect an effect in the test geo in comparison to the control geo.
Because the power analysis does a broader range of simulations over more days than the initial test market selection, it may find that the settings you selected are not providing a meaningful test, and will recommend that you increase your spend amount or change other parameters.
Alternatively, it may find that many of the simulations resulted in false positives, meaning that statistically significant lift was detected in many scenarios even when we simulated no true lift. In this case, we flag this set of geographies as containing a high false positive rate and recommend you find other geographies to use as your test group.
Exporting Progress
GeoLift doesn’t currently support saving to a database within the app. Instead, we provide a series of export buttons that allow you to download your progress as you work through a Design.
Depending how far you’ve progressed in your Design activity, the following information may be available:
-
A JSON file containing all settings configured in the left hand panes
-
A CSV of the data after it’s been filtered and processed
-
A CSV listing the locations that were recommended as test geographies
-
Plots of the simulation and power curves
-
A JSON containing the final recommendations from the power analysis
The downloads are cumulative so the button under Step 2 will contain all the information from Step 1 and Step 2, so you don’t need to download each step separately.
This info can be helpful in saving what you tried for future reference. If reaching out to Recast Support through the chat widget in the bottom right of the app, please provide this export file (and the original uploaded data) so we can more easily see what went wrong.
Geo - A set of locations
Test Geo - The set of locations where we will implement a spend change for the duration of the experiment.
Synthetic Control Geo - These are weighted conversions in the control group. We use this to simulate the experiment and determine the probability of significant results.
Lift - The incremental effect of the spend change in the test geo.
Approximate CPA - this is a reasonable guess at the spend required to acquire a customer in the channel of interest. This is used to calculate the total spend required in the experiment to produce the number of conversions required for statistical significance in the test geo. A higher CPA means that you will need to spend more to drive the conversion.
Experiment length - The number of days during which we will implement the spend change in the test geo.
Bias - The simulated difference between the actual incrementality and the effect estimated by the experiment analysis.