Once you have conducted a geographic experiment you can upload the results of your experiment and use the Analyze tool to estimate the incrementality of the channel you experimented with.
Step 1: Ingest your data
First we need a dataset of the historical outcome variable for each day for each geography both before and during the experiment. Geographies can be at any level that you have the ability to target (e.g. states, DMAs, etc). If you use ZIP codes as the geography, GeoLift can automatically convert these to Commuting Zones (see here for more information about how that conversion works). To analyze an experiment, you will need at least 90 days of data prior to the end of the experiment, 30 of which happen before the test starts. Ideally, you will upload around a year of data pre-test along with the test data. We also recommend uploading several weeks of data post-experiment to use as the “Cooldown Period” described in the next section. Data will be truncated to the most recent 365 days of pre-test data if you upload more than one year of pre-test data. Your CSV should contain 3 columns:
-
Location (geography)
-
Date
-
KPI
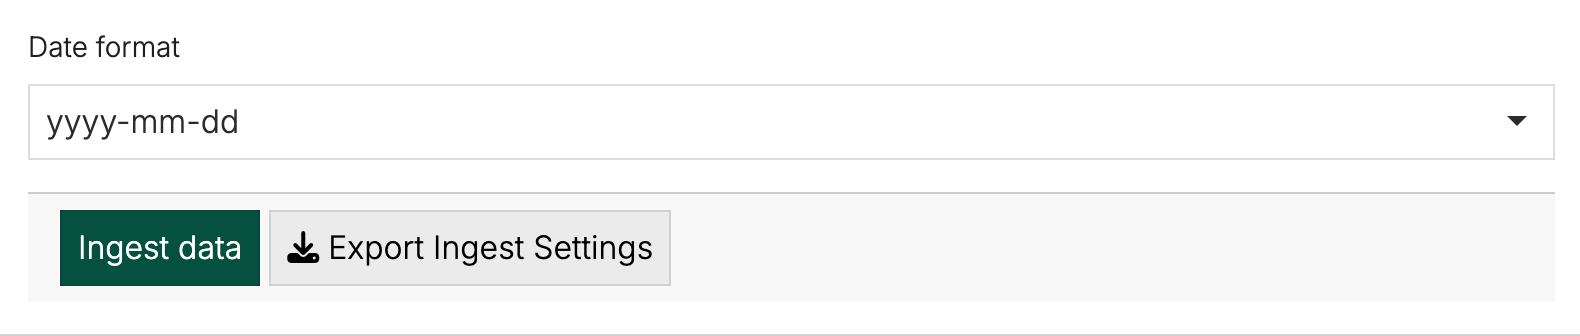
You can use the tool to map the columns in your dataset to the date, outcome variable and location ID columns as well as specify the date format in your dataset. If a geography/date combination is missing, or if the KPI value is missing for a particular geography/date combination, GeoLift will assume the KPI was 0 on that day.
Step 2: Configure your analysis
To configure your analysis select the following inputs:
-
The start and end dates of the test
-
The end of the cooldown period
-
The locations included in the test geos
-
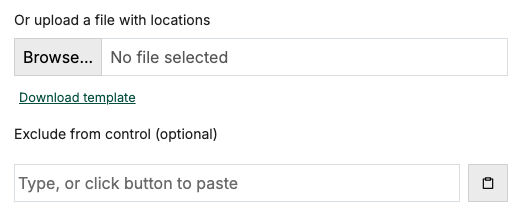
Any controls to exclude (e.g. controls that may have been contaminated with impressions from the test spend)
-
The outcome variable type
-
The experiment type (spend increase or decrease)
-
The spend withheld or added to the test locations
The start and end dates should align with when spend was turned up (or down) and then put back to normal. The end of the cooldown period should be chosen as when you want to stop analyzing the data for additional conversions. The analysis will provide an estimate of the amount of revenue (or number of conversions) attributable to the experiment between the start date and the end of the cooldown period. For example, if you think someone who is influenced by an ad in the channel might not convert for 2-3 weeks, you may try to set the cooldown window 2-3 weeks after the end date. If the analysis window is too short, you may end up undercounting the true incremental effect and making the channel look less effective. If the analysis window is too long, added noise will cause your confidence intervals to grow and reduce the statistical significance of the results. We recommend choosing an analysis window such that the majority (~95%) of conversions you expect to come from the increased spend (or conversely, not happen due to decreased spend) have been observed in the historical data. Your Recast MMM shift curves may be helpful in setting the analysis window.
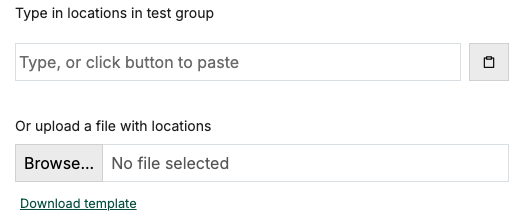
Providing test locations
Locations can either be typed in manually, pasted from your clipboard, or you can provide an additional file that specifies the test locations. The file should be a CSV with column header “locations” (if the first row does not have “locations” the text in the first row will be treated as a location). Any uploaded location not found in your dataset (from Step 1) will be thrown out, with a warning. If using the clipboard option, you will need to click the clipboard icon seen above (control+v will not work). Items need to be separated by a newline character (like they are if you copy rows from Excel) or by a semicolon.
If you are mapping zip codes to Commuting Zones, you need to upload the Commuting Zone names at this step, not the zip codes.
The number of test geographies are limited to 250 locations. If your test had a large number of locations, you may need to consider using a higher unit of analysis (e.g. DMA instead of zip code) to be able to analyze the test.
Step 3: Analyze your results
The analysis looks like the following:
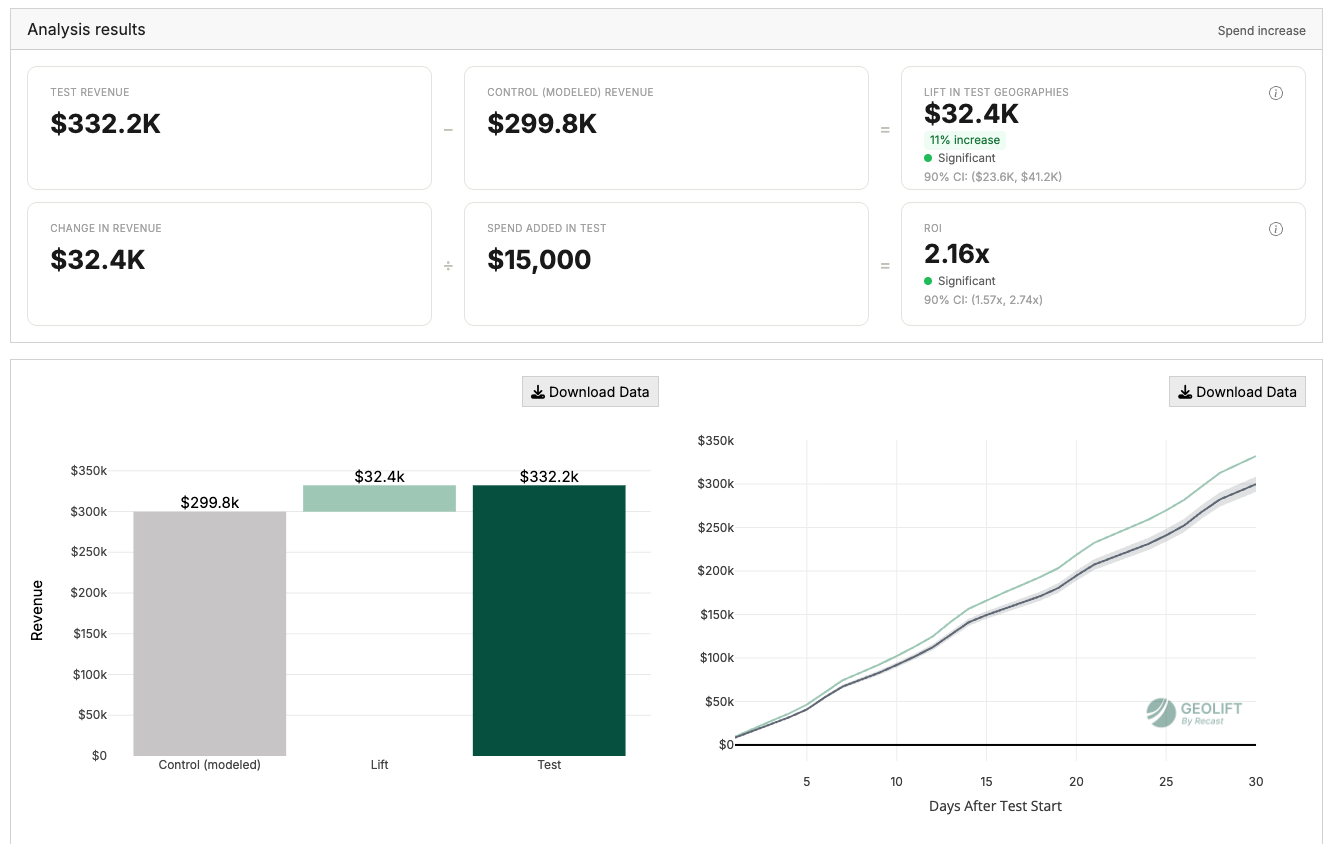
You will be able to see Recast’s estimate of the incremental lift and whether or not your results are statistically significant. The statistical significance is determined by a two-tailed test at a 0.1 alpha level (which aligns with the 90% confidence interval). However, if the results are significant in the opposite direction than expected (e.g. a spend cut resulting in increase in revenue/conversions), then a yellow triangle will flag a warning. These results can be incorporated into your Recast MMM by providing your model building team the data export .zip file. Recast does not require “statistical significance” in order to incorporate the experiment results (insignificant results typically just mean larger confidence intervals). For more information about how to configure the experiment into the Recast MMM, see this article.
The graphs show the difference in KPI output in the test and control geographies as well as the cumulative output over time in the test and control geographies. Using these graphs you can see the impact of your experimental spend change on the test geo compared to the control geo.
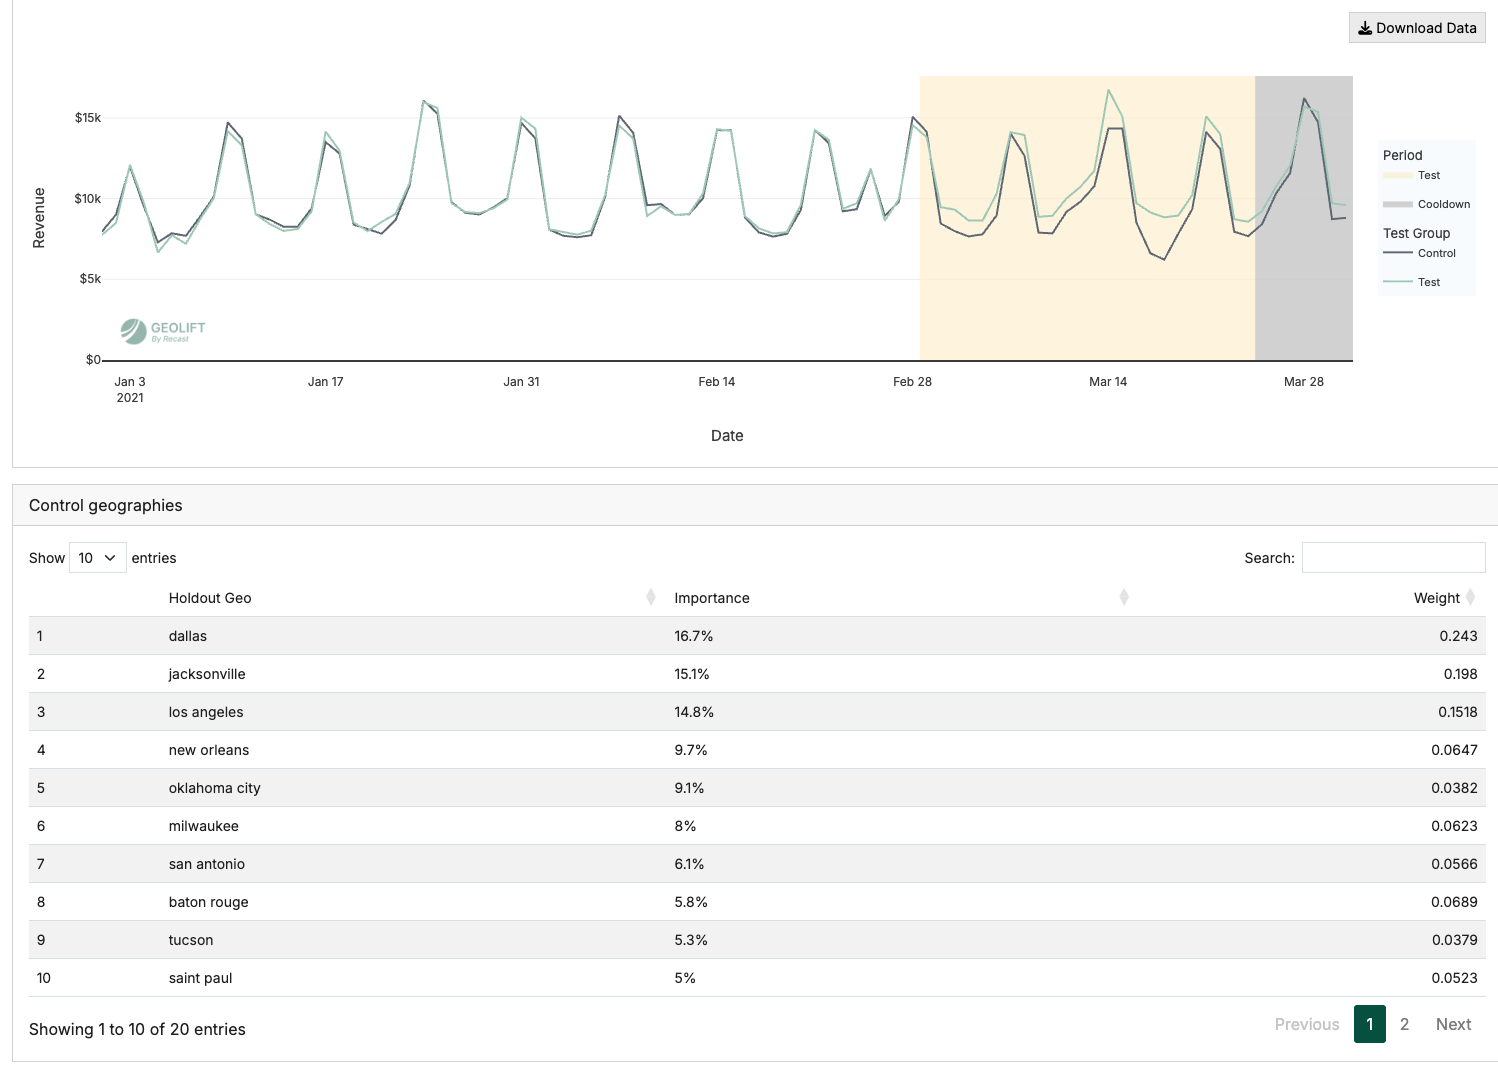
Below, you will see two more pieces of information. One shows the pre-treatment, treatment, and post-treatment fit. If the pre-treatment fit is poor, it is more difficult to assign causality to the experimental spend during the treatment period. We want the modeled control and the test groups to be as close as possible in the pre-treatment time period. If the post-treatment is showing a significant gap between the test and the control geographies, you may not have made your cooldown period long enough, and you should consider extending it.
Underneath is a table of the control geographies and an “Importance” and “Weight” metric for each. Weight is the number the control was multiplied by before being added to the synthetic control. Importance is the weight multiplied by the number of pre-test conversions/revenue, divided by all control pre-test conversions/revenue. If a region is large, it might have a small weight but still make up a big portion of the synthetic control, so it will get a high importance. If an important control was particularly close to a test region, and you are worried about impression leakage from the test geography to the control geography, you can re-run the analysis after adding the control geography to the “Exclude from control” field.
Exporting Progress
GeoLift by Recast doesn’t currently support saving to a database within the app. Instead, we provide a series of export buttons that allow you to download your progress as you work through an Analysis.
Depending how far you’ve progressed in your Analysis, the following information may be available:
-
A JSON file containing all settings configured in the left hand panes called user_inputs
-
A CSV of the data after it’s been filtered and processed
-
A CSV listing the results of the analysis (incremental units, ROI/CPAs, uncertainty, scaled pre-test RMSE)
-
A CSV listing the controls used and their associated weights
-
Plots of the time series, cumulative KPI, and waterfall.
The downloads are cumulative so the button under Step 2 will contain all the information from Step 1 and Step 2, so you don’t need to download each step separately.
This info can be helpful in saving the analysis results for use elsewhere. If reaching out to Recast support through the chat widget in the bottom right corner, please provide this export file (and the original uploaded data) so we can more easily see what went wrong.